Fuel is expensive, so reduce your costs by learning to interpret satellite fishing maps and get into the fishing zone faster. Learn to interpret satellite maps to find the bait at game fishing hotspots, and save fuel getting there. Tap into Sam McClatchie’s 30+ years of oceanographic knowledge to point you to the areas where plankton and baitfish concentrate.
We engage with Fishing Maps subscribers to answer your questions and provide guidance.
We use plain language in Facebook posts, blogs, and videos to help you interpret satellite fishing maps based on deep knowledge of ocean science.
Have a question about Fishing Maps for your region? We help subscribers to interpret SST, temperature breaks, currents, SSH & chlorophyll patterns in our fishing maps.
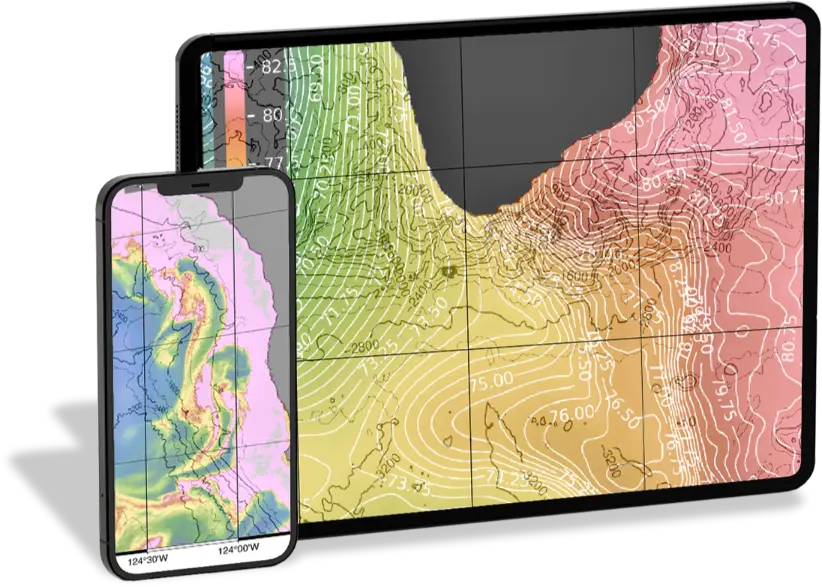
Get the clearest Sea Surface Temperature (SST) on the market. Track fishing hotspots and find the game fishing zone using 4 days of cloud-free SST satellite charts. Locate boundaries between warm and cool water with accurate, frequently updated, clearly contoured, SST charts. No more frustrating empty images.
Temperature breaks are the gold in SST game fishing charts. Detecting them has never been easier than using Fishing Maps. Find the game fishing zone and fishing hotspots using our 4-day temperature break maps showing where the fronts persist over several days. Close in on the fishing hotspots with the strongest temperature breaks, where the bait aggregate, using our unique SST game fishing chart gradient maps.
Define productive Chlorophyll edges and fronts with the highest resolution imagery available in our chlorophyll charts. Our maps are different because we highlight the detail in the low chlorophyll range where most of the big game fish occur. Clearly separate the cloudy high chlorophyll water and define the fishing zone where green coastal water transitions to clear blue oceanic water. Avoid the empty map problem by viewing our 4-day sequence of chlorophyll charts which reduce the impact of clouds.
Altimetry is critical for defining game fishing zones, but maps showing large sea surface height features can lose detail. We present clear currents that are driven by the sea surface height differences shown by altimetry, so you can define fishing zones and hotspots directly from the currents in the small regions where you fish. Detect converging currents, rotating currents (or eddies), reversing currents (current shear), and counter-rotating eddy pairs to get in the game fishing hotspot zone with our current velocity maps.
Check the most recent SST to see if temperature breaks are moving. Get hourly SST images as recent as 5 hours (currently only available for New Zealand)
Fishing Maps for New Zealand, West Coast U.S. & Baja,
Australia, Costa Rica, Guatemala & Panama
At Fishing Maps, we specialize in the regions of New Zealand,West Coast U.S. & Baja, Central America, and Australia leveraging decades of expertise and in-depth knowledge to provide the most accurate and effective charting solutions for these prime fishing locations.
We have been using Sam’s SST, Chlorophyll and current maps for a couple of years now and they have proven every time putting on the spots straight away for getting the stripes out west this year we have caught 27 for 13 days fishing, so very grateful for Sam to be producing these maps. Cheers Mate